Our tenth release of tracking data for oil, gas, and coal extraction projects is live and available. In this update, we’ve pulled in updated datasets with a focus on coal, along with methodology improvements and countless corrections. We’ve already spent hundreds of hours building new statistics, diving into mitigation opportunities, researching, upgrading our compute and web platforms, and authoring reports. This revised data sheds new light on the activities of fossil fuel extraction companies in our most crucial protected conservation areas, and the results are eye-opening…
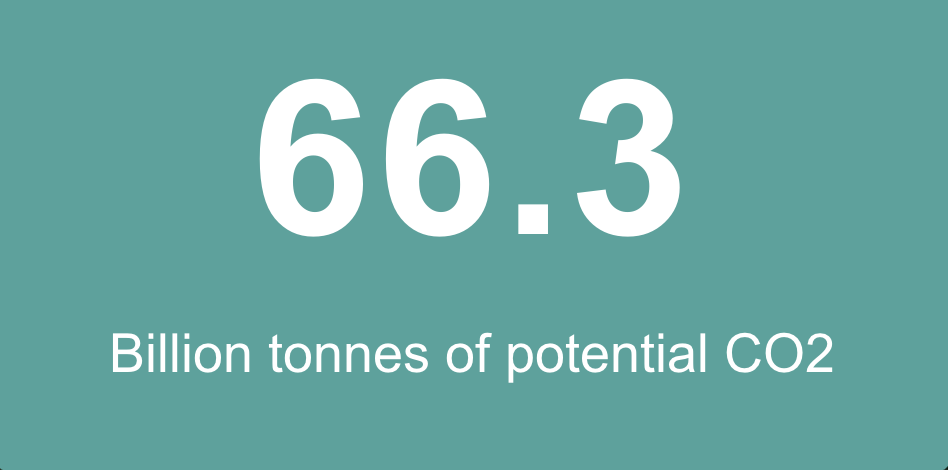
Suppose all the fossil fuel extraction projects we’ve identified in the world’s protected areas are allowed to start or continue. In that case, their output will add a potential 66.3 billion tonnes of CO2 to the planet’s atmosphere. This number is up substantially from v9’s 50.8 billion tonnes due to our expanded coal coverage, courtesy of Global Energy Monitor’s April 2024 update, which added hundreds of new mine locations to their already impressive Global Coal Mine Tracker effort.
Coal mining has an outsized carbon impact, releasing roughly 2 tonnes of CO2 for every 1 tonne burned. We can see a few new coal projects that are individually contributing gigatonnes of CO2 to the climate crisis. A thermal coal mine has already impacted South Africa’s Vhembe UNESCO biosphere reserve, but planned expansions and new mines threaten to release an eye-watering 6.2 billion tonnes of emissions into the atmosphere from just this one internationally recognised conservation zone. Similar stories exist in Colombia, along with other countries that are still investing in this dirty industry.
This expansion reminds us to treat Protected Carbon’s statistics and estimates as minimums. The most common value in our data is “Not Available.” As we work to fill in missing information and add new extraction assets, this number will continue to rise even further.
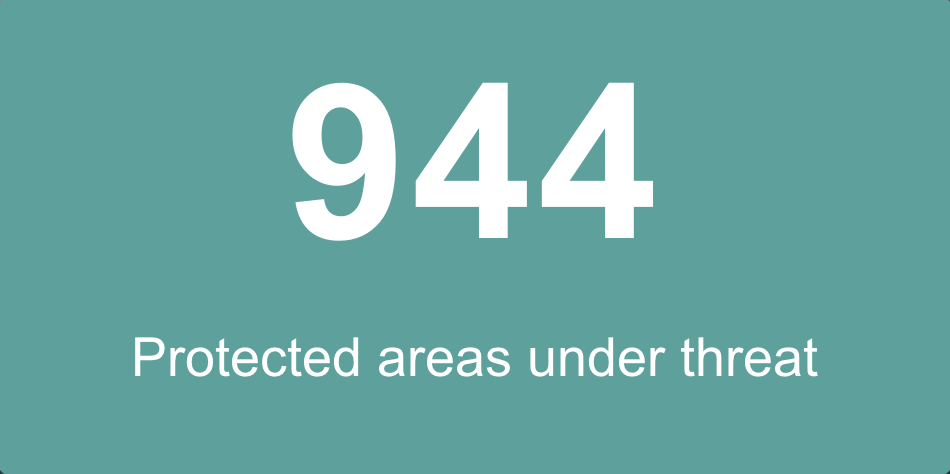
In addition to Global Energy Monitor’s advancements, the World Database of Protected Areas has been updated with thousands of verified conservation zones worldwide. This has generated more overlap in our maps between extraction projects and protected areas. Besides contributing to the 66.3 GT headline stat, these updates have grown the number of protected areas from v9’s 851 to 944.
It’s important to know that this number includes overlapping protected area designations. For example, Canada’s Banff National Park largely (but not wholly) overlaps with the Rocky Mountains UNESCO World Heritage Site. If a fossil fuel extraction project is planned for a spot covered by the national park and UNESCO site, both protected areas are considered under threat.
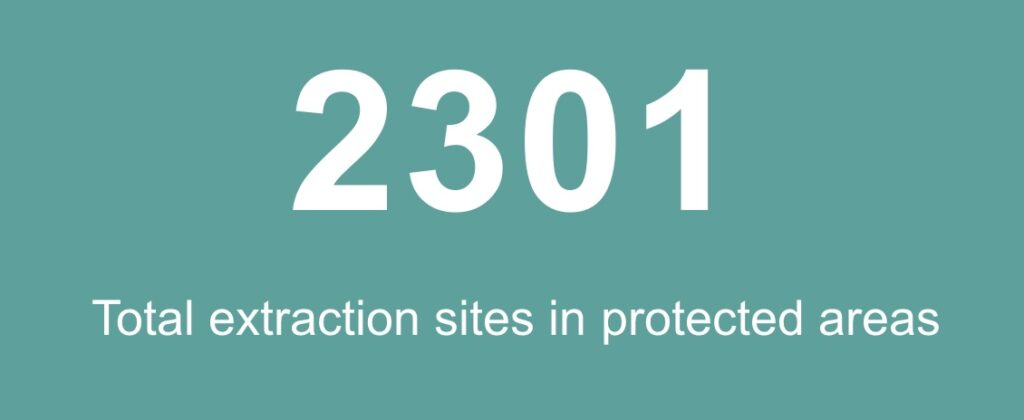
Compared to our previous releases, the new v10 dataset lists 2301 extraction projects, down from last year’s 2337. Did 26 projects get cancelled?
The answer is… no. The number of oil, gas, and coal extraction assets in protected areas we’re tracking has actually grown since last year, but we’ve changed how we count projects to be more in line with the general public. Often, a hydrocarbon extraction project produces more than one type of fossil fuel, such as crude oil and fossil gas. Our data source (Rystad) treats these separate outputs as unique projects since they are sold on different markets, which reflects Rystad’s investor-based focus. Most people would consider an extraction field that produces a mixture of oil and gas to be the same project, and as of v10, so does Protected Carbon. Combining these mixed-output projects lowers the total count of extraction projects in protected areas, but we believe it is the right thing to do.
Jump in. Find out.
Enough hype. Where can you access the new information?
This site has received a refresh with our new “headline” totals displayed on the home page and our NDC page, which has also been updated with new country reports.
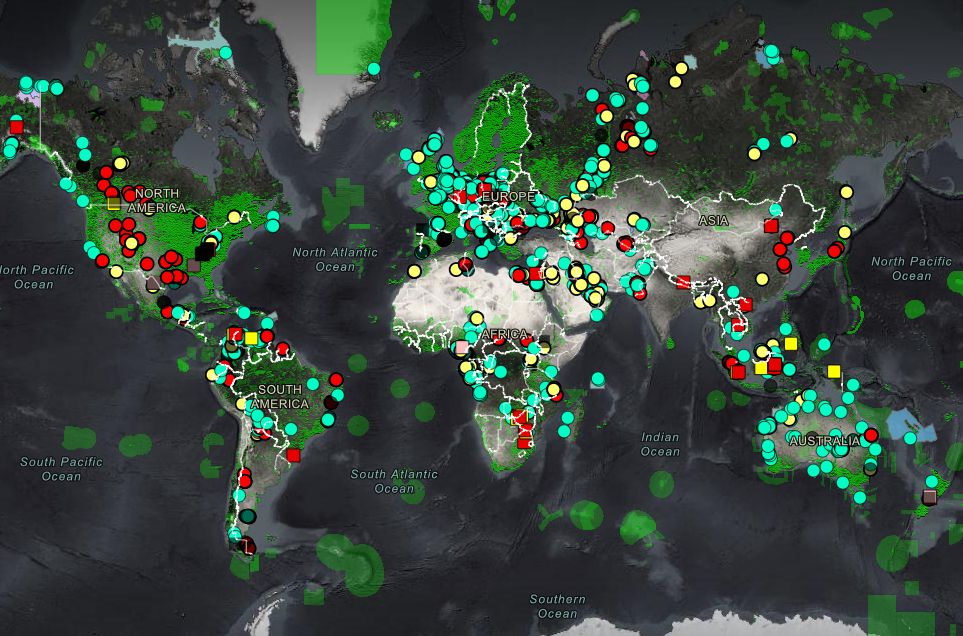
The extraction map has been rebuilt from the ground up. Quick-loading, mobile-friendly, and tool-enabled, this new interactive map provides more information than ever on threatened conservation areas and fossil fuel extraction projects.
Want to create your own map or integrate our work into your GIS-based research? Shapefiles, a geodatabase, and (for the first time) an ArcGIS Pro map package file are available to download.
With v10, our myriad data spreadsheets have been consolidated into one combined resource, allowing you to quickly find the data you’re looking for. Start-up dates, designations, and profiting companies are now listed for projects in each protected area, along with potential CO2 emissions.
There has never been a better time to explore our online maps, check your country’s mitigation potential, and get involved with our campaign to end fossil fuel extraction in the world’s most valuable natural treasures!